.svg)
The Most Important Amazon Seller Metrics for FBA Businesses
Download Amazon Seller Guide
This guide will help you get started, understand the basics of Amazon selling, and explain in simple words how it all works.

Running a successful Amazon FBA (Fulfillment By Amazon) business is all about knowing your numbers. Whether you're reselling through Amazon wholesale, Amazon dropshipping, or Amazon online arbitrage, keeping track of the right Amazon seller metrics can make or break your profit margins.
In this post, we’ll walk you through the most important performance indicators that every FBA seller needs to monitor – especially if you want to scale sustainably and avoid unexpected pitfalls.
From sourcing and sales to account health, you’ll find the exact metrics that help you stay competitive, compliant, and consistently profitable.
What Are Amazon Seller Metrics?
Amazon seller metrics are specific data points that track how well your Amazon FBA business is performing across various areas – from sourcing products to managing inventory, sales, and account health. These metrics act like a business dashboard, helping sellers make smarter decisions, avoid costly mistakes, and stay competitive in Amazon’s algorithm-driven marketplace.
Failing to understand or monitor these numbers can lead to poor purchasing decisions, stock mismanagement, unexpected losses, or even Amazon account suspension. That’s why tracking the right metrics at the right time is essential to running a profitable and sustainable FBA business.
Key categories of Amazon seller metrics
Product sourcing metrics
These are the metrics sellers should evaluate before making a purchase or choosing a supplier. They help determine whether a product is worth sourcing and if a supplier is profitable. This data is key for resellers – whether you're doing Amazon wholesale, Amazon online arbitrage, or Amazon dropshipping – because it minimizes risk and helps you avoid buying dead inventory or dealing with wrong brands or suppliers.
Operational performance metrics
These are the metrics you track during your business operations to keep things running smoothly. They include sales, profitability, Amazon FBA fees, inventory levels, and account health indicators. Keeping a close eye on these metrics helps you stay profitable, avoid Amazon policy violations, and react quickly when performance issues arise. They're essential for maintaining a healthy seller account and scaling your business effectively.
Why Amazon Seller Metrics Matter
For anyone running an Amazon FBA business, knowing your numbers isn’t optional – it’s how you survive and scale. Amazon seller metrics offer a real-time view of how your business is performing and highlight what needs to be improved, optimized, or avoided. Whether you're sourcing products or managing ongoing operations, these metrics give you the insight needed to make profitable decisions and stay compliant on Amazon’s platform.

Help you make smarter sourcing decisions
Metrics like Return On Investment, sales rank, and historical price trends let you evaluate products and suppliers before investing. This reduces the chances of buying slow-moving inventory or partnering with unreliable sources.
Protect your account from suspensions
Amazon tracks your performance closely – and so should you. Monitoring metrics like Amazon Order Defect Rate, late shipment rate, and Amazon policy violations helps you stay within Amazon’s rules and avoid costly account suspensions.
Increase your profit margins
By analyzing profit, Return On Investment, margins, sales velocity, refund rates, and fee breakdowns, you can spot where money is leaking and adjust your pricing, sourcing, or strategy to increase profit on each sale.
Support better inventory planning
Inventory-related metrics such as sell-through rate and days of supply let you avoid both overstocking and stockouts. This ensures smoother operations and higher chances of winning the Buy Box.
Boost sales performance
Strong seller metrics improve your chances of winning the Amazon Buy Box. Amazon rewards sellers who meet performance standards with better visibility – which directly impacts revenue.
Give you full control over your business
With the right data, you're not guessing – you're making informed decisions. From restocking and repricing to running ads or pausing a product, metrics allow you to take strategic actions based on facts, not assumptions.
Product Sourcing Metrics
Product sourcing metrics are essential for evaluating both the products you plan to resell and the suppliers you source them from. These metrics are used during the deal and supplier research stage – before any money changes hands. By running each opportunity through a checklist of key indicators, you can spot profitable deals and avoid high-risk or low-quality suppliers. This process ensures you’re sourcing smart, not just buying blind.
Product (deal) research metrics
Finding profitable products to resell on Amazon isn’t about guesswork – it’s about data. Every product you consider comes with risks, fees, and competition that can directly impact your profit. That’s why thorough product research is essential before making any purchase decision.
Analyzing a wide range of metrics helps you understand the full picture – from demand and pricing trends to competition levels, Amazon FBA fees, and potential account risks. Skipping this step can lead to unsellable inventory or account issues. Smart sourcing means using data to make confident, profitable choices every time.
Sales performance metrics
These metrics show how well and how fast the product sells on Amazon. Metrics like Amazon Best Sellers Rank (BSR), sales velocity, and BSR drops help estimate demand and determine how quickly you’ll be able to sell your stock. High sales performance means less time in storage and quicker return on investment.
- BSR (best sellers rank)
Indicates how well a product sells within its category on Amazon. A lower BSR generally means higher sales volume. A “good” average BSR is between 1 and 200,000.
- Top BSR
Shows sales velocity as a category percentile. A top BSR under 0.5% means fast sales; 1% or above suggests slower-moving inventory.
- Average BSR over 30/90/180 days
Evaluates sales consistency over time. This helps avoid products with short-lived demand spikes.
- Sales estimate (pcs/month)
Predicts how many units a product sells monthly. This guides how much inventory to order.
- Sales estimate ($/month)
Estimates monthly revenue. Useful for forecasting revenue and evaluating high-potential deals.
- Product rating
Shows average customer satisfaction. Higher ratings typically signal fewer returns or issues.
- Review count
Indicates social proof and competition level. A high review count can mean both trust and saturation.
Pricing and profitability
This category tells you if a product meets your profit expectations. It includes profit, Return On Investment, and margin calculations, based on your Cost of Goods (product price at the supplier), Amazon FBA fees, and logistics. You’ll also compare FBA vs. FBM fulfillment options to choose the most profitable approach.

- COG (Cost of Goods)
The supplier’s price before tax. A key baseline for calculating profits.
- Cost of Goods incl. VAT
Total unit cost including applicable VAT. Relevant for EU-based sellers.
- Buy Box price
The current price held by the Amazon Buy Box winner. Used to project your competitive price.
- Buy Box price over 30/90/180 days
Historical average Amazon Buy Box prices. Helps you avoid overpriced or underpriced market entries.
- Price dynamics (%)
Shows how much the product price fluctuates. Useful for identifying price-stable items.
- Min FBA/FBM price
The lowest recent price for FBA/FBM offers. Helps assess floor pricing risks.
- Break-even price (FBA/FBM)
The price at which you make 0% profit using FBA or FBM. Selling below this means a guaranteed loss.
- Profit (FBA/FBM)
Profit is your real earnings after all costs are deducted from the sale. Formula: Selling price – COG – Referral Fees – Amazon FBA Fees – Storage Fees – Sales Tax (if applicable) – VAT (if applicable) – 3PL and Shipping (if applicable)
- ROI (FBA/FBM, %)
Return on Investment (ROI) measures how much profit you’re earning relative to your initial cost. It’s expressed as a percentage and helps compare opportunities side by side. Formula: ROI = (Profit ÷ [COG + Sales Tax + 3PL Costs]) × 100%
- Margin (FBA/FBM, %)
Profit margin after all fulfillment-specific fees and costs. Margin shows what percentage of your selling price is profit. It’s a core measure of how efficient a product is at generating returns. Formula: Margin = (Profit ÷ Price) × 100%
Competition analysis
These metrics evaluate how many sellers are offering the same product and whether Amazon itself is a seller. Metrics like FBA/FBM offer count and Amazon Buy Box presence help you understand your chances of winning the Buy Box and whether the product is already saturated with competitors.
- FBA offer count
Number of competing sellers using Amazon FBA. More FBA offers usually means higher competition for the Amazon Buy Box. Ideal count is 3 to 15 sellers. Less means private label products you can't resell; more means fierce competition.
- FBM offer count
Number of FBM competitors. Useful for spotting gaps in FBA-heavy niches.
- Amazon in in the Buy Box 30/90/180 days
Shows how often Amazon has held the Buy Box. Competing against Amazon is very difficult; if it dominates the Buy Box, margins are low and unpredictable.
Fulfillment costs
These include all expenses tied to storing, packing, and shipping the product. You must track FBA/FBM fees, Amazon storage fees, inbound shipping, prep costs, and any hazmat or fragile handling fees to get a complete picture of true product costs.

- Total FBA/FBM fees
Sum of all fulfillment-related costs depending on method.
- FBA fees
Amazon’s fee for picking, packing, and shipping products.
- Referral fee
Amazon’s percentage cut from each sale, based on category.
- Storage fees
Monthly charge for keeping your inventory in Amazon’s warehouses.
- Variable closing fee
Special fee for BMVD products (Books, Music, Video, DVDs).
- Digital service fee (DST)
Applied to certain countries for selling and FBA services. Check if you’re affected.
- Inbound shipping costs (FBA)
Your cost to ship inventory to Amazon's fulfillment center.
- General prep FBA
Cost of labeling or prepping products before they are shipped to Amazon.
- Shipping cost per unit / per lbs
Used to calculate logistics costs. Heavier or bulkier products drive this up.
- Hazmat fee FBA
Applied if the product is classified as Amazon hazardous materials category.
- Fragile prep FBA
Extra cost for special handling of Amazon fragile products.
- Misc fee rate (%) / misc fee fixed / misc fee
Covers any additional fee items. Helps get a full picture of total costs.
Tax and compliance
These metrics include sales tax, VAT on fees, and whether the product is subject to region-specific digital service taxes (DST). These hidden costs can significantly reduce profitability if not accounted for.

- Sales tax / sales tax rate (%) / apply sales tax
Shows if sales tax applies and how much to account for in final pricing.
- VAT on fees / VAT on fees rate (%)
VAT added to Amazon’s service fees for international sellers. Can impact profit margin.
Product restrictions and flags
Here you assess product eligibility and risk. Look for Amazon restrictions, gating status, IP complaint flags, and alerts like hazmat, meltable, or fragile status. These indicators warn you of potential selling hurdles or added prep and compliance steps.

- Restrictions and selling eligibility
Tells you if you can sell a product on your Amazon account and whether a product is gated and requires approval to sell.
- Warnings
Flags products with issues like missing data, no Amazon Buy Box, too high Return On Investment, or no Amazon FBA fees.
- Alerts and flags
Hazmat, Amazon meltable, Amazon fragile, heavy and bulky, adult products, generic brands. Alerts that affect fees, storage, and prep costs. Must-know before listing.
- IP complaints flag
Shows risk of intellectual property complaints and Amazon policy violations. High-risk products should be avoided.
- Variation flag / Set-bundle flag
Used to identify multi-variation listings or bundles.
Variations
Products with multiple variations (like size, color, or flavor) are often harder to predict in terms of demand. You’ll want to review parent ASINs, variation counts, and sales data per variation to avoid picking a slow-selling SKU.
- Parent ASIN
The parent ASIN, if the product has multiple variations/ Collects the product family and available variations.
- Variation count
The number of variations in the listing
- Color
Color of a specific variation
Dimensions and packaging
These metrics cover the product’s physical size, weight, volume, and package quantity. These attributes directly affect storage fees and shipping costs, especially if the product is heavy and bulky.

- Size info
Amazon's size classification affects FBA fulfillment and storage fees.
- Height, width, length, weight
Used for shipping rate and prep requirements.
- Product volume
Helps estimate storage space and cost.
- Package quantity
Number of items per unit. Important for price-per-unit calculations.
How to calculate deal metrics
Calculating product metrics is a critical part of Amazon sourcing. Whether you’re sourcing for wholesale, online arbitrage, or dropshipping, analyzing a product’s profitability, competitiveness, and risk factors before you buy is what separates successful sellers from those stuck with unsellable inventory.
There are two primary ways to calculate these deal metrics:
- In bulk for wholesale price lists
- Individually for single product analysis
Bulk analysis: Seller Assistant’s Price List Analyzer
When it comes to Amazon wholesale sourcing, one of the most important steps is analyzing the supplier’s wholesale price list. To make sourcing efficient and data-driven, you need to automate the evaluation of key product metrics, profitability, competition, and potential risks. This allows you to filter out low-potential products and focus on the most profitable, low-risk opportunities.
Seller Assistant's Price List Analyzer streamlines this process by turning raw spreadsheets into actionable insights. It’s a specialized tool for bulk wholesale list scanning.
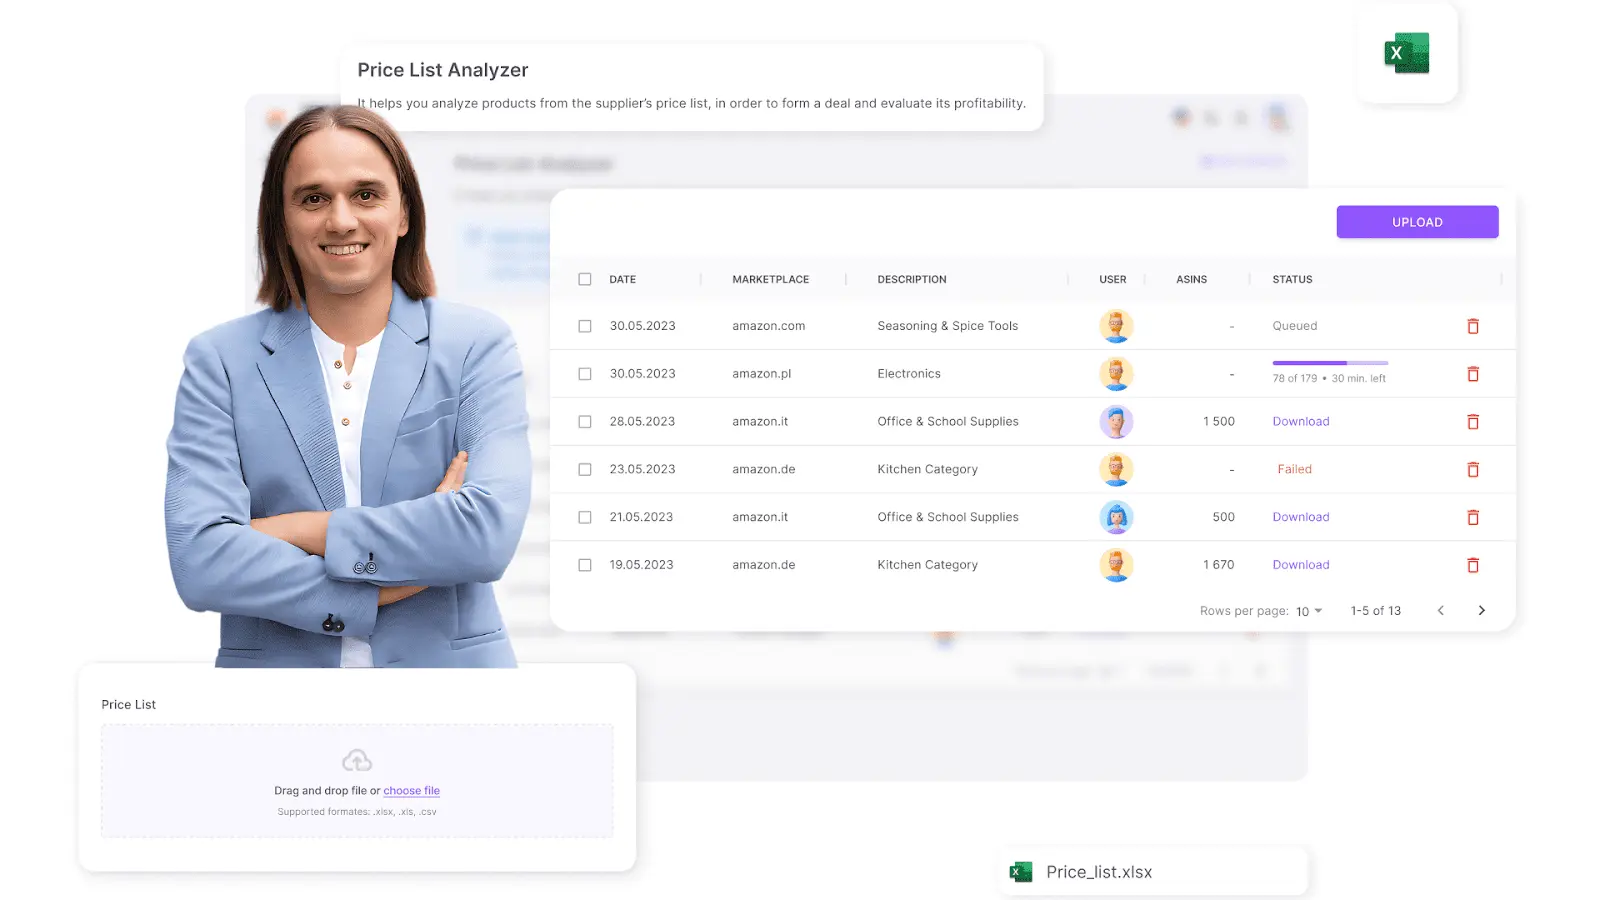
The tool automatically matches your supplier’s items to their corresponding Amazon listings. Once uploaded, your wholesale list is enriched with all vital product metrics mentioned in the above section, including Amazon pricing and Buy Box history, estimated profit, Return On Investment, and margin, eligibility and selling restrictions, product flags (IP alerts, hazmat, heavy and bulky, etc.), competitive offers (FBA/FBM/AMZ in-stock rate), and more.
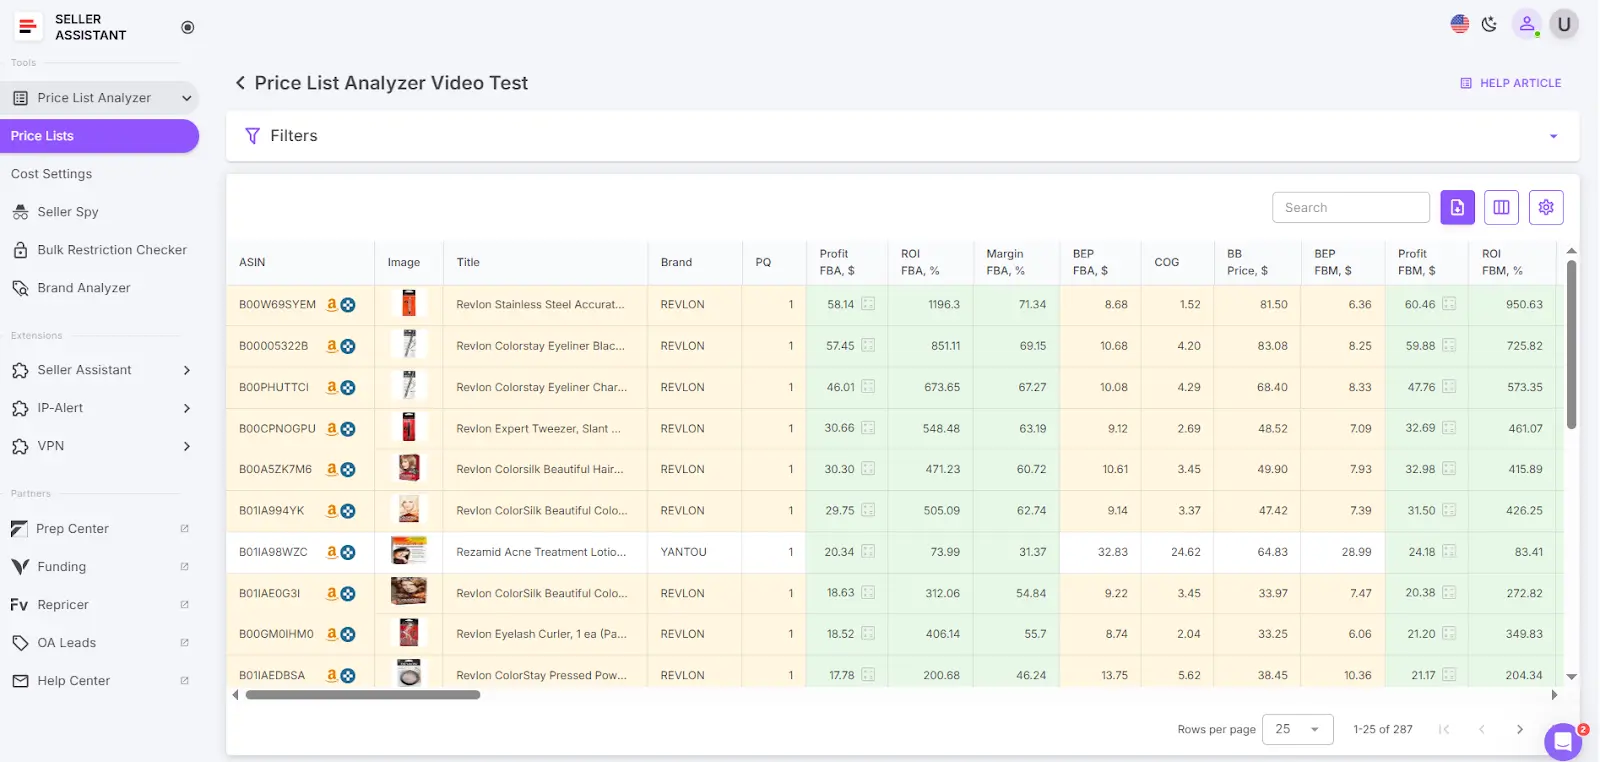
You can sort and filter the updated spreadsheet based on your criteria, or download the enriched Excel file for further review. This automated process saves hours of manual research and helps you confidently pick the best deals at scale.
Note. Seller Assistant is a comprehensive product-sourcing software that helps Amazon sellers quickly find high-profit deals. It combines three extensions: Seller Assistant Browser Extension, and IP-Alert Chrome Extension by Seller Assistant, and VPN by Seller Assistant, Amazon seller tools: Price List Analyzer, Brand Analyzer, Seller Spy, Bulk Restrictions Checker, and API integrations, and features: Storefront Widget, Side Panel View, FBM&FBA Profit Calculator, Quick View, Stock Checker, IP Alert, Variation Viewer, Sales Estimator, Offers, and Restrictions Checker.
It offers a robust toolkit of over 20 features built to streamline every part of the sourcing process – from bulk scanning wholesale supplier sheets for high-margin leads to deep product research and advanced brand and competitor analysis. By using this FBA and FBM product sourcing software, you can easily identify products that have the potential to be sold well on Amazon.
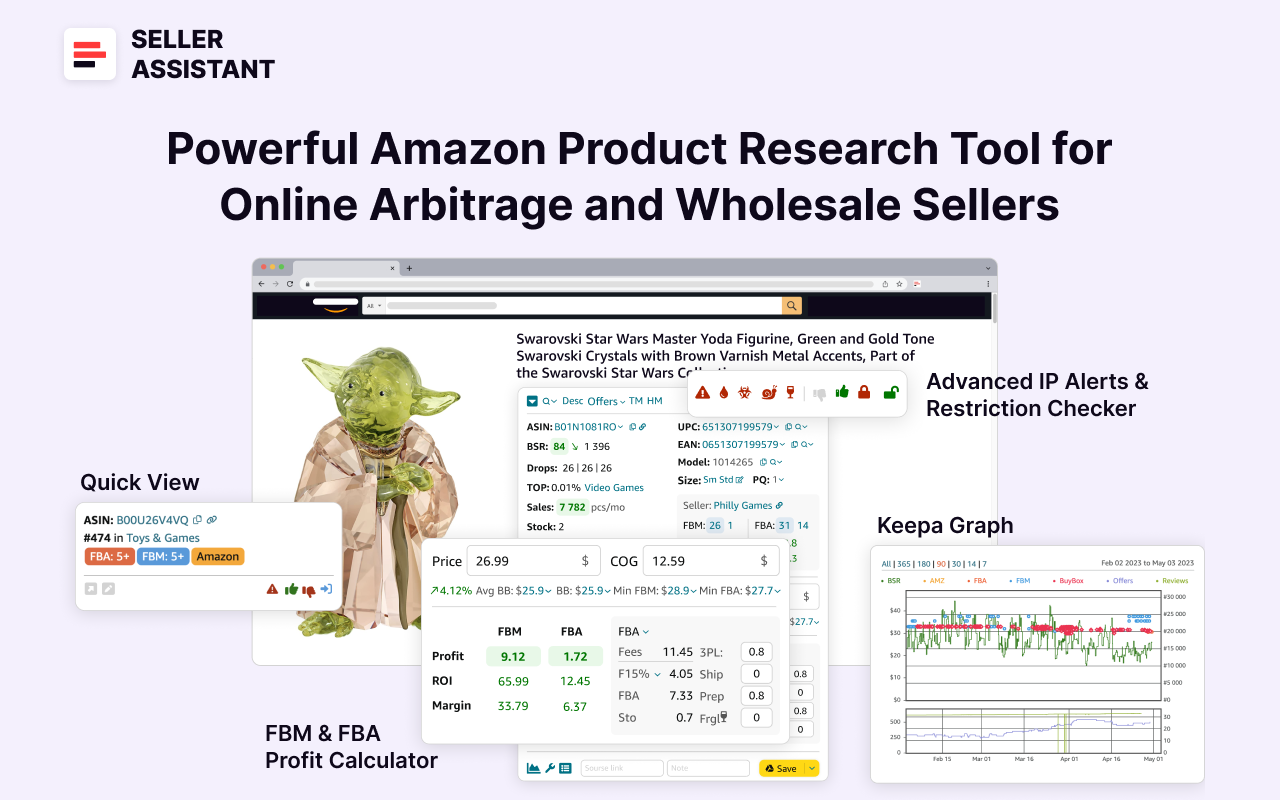
Single product analysis: Seller Assistant Extension
For Amazon online arbitrage or Amazon dropshipping, analyzing individual products is just as important. After identifying a potential deal, you need to verify whether it aligns with your profit goals and risk tolerance before adding it to your catalog.
Seller Assistant Extension is an all-in-one browser tool designed for this. It overlays real-time data directly on Amazon product and search pages, supplier websites, and competitor storefronts, giving you deep insights without leaving the site. You get immediate visibility into all key deal sourcing metrics we discussed, like Profit, Return On Investment, and margin breakdowns, sales history and BSR trends, Buy Box ownership and offer counts. restrictions, eligibility, and product flags, and more.
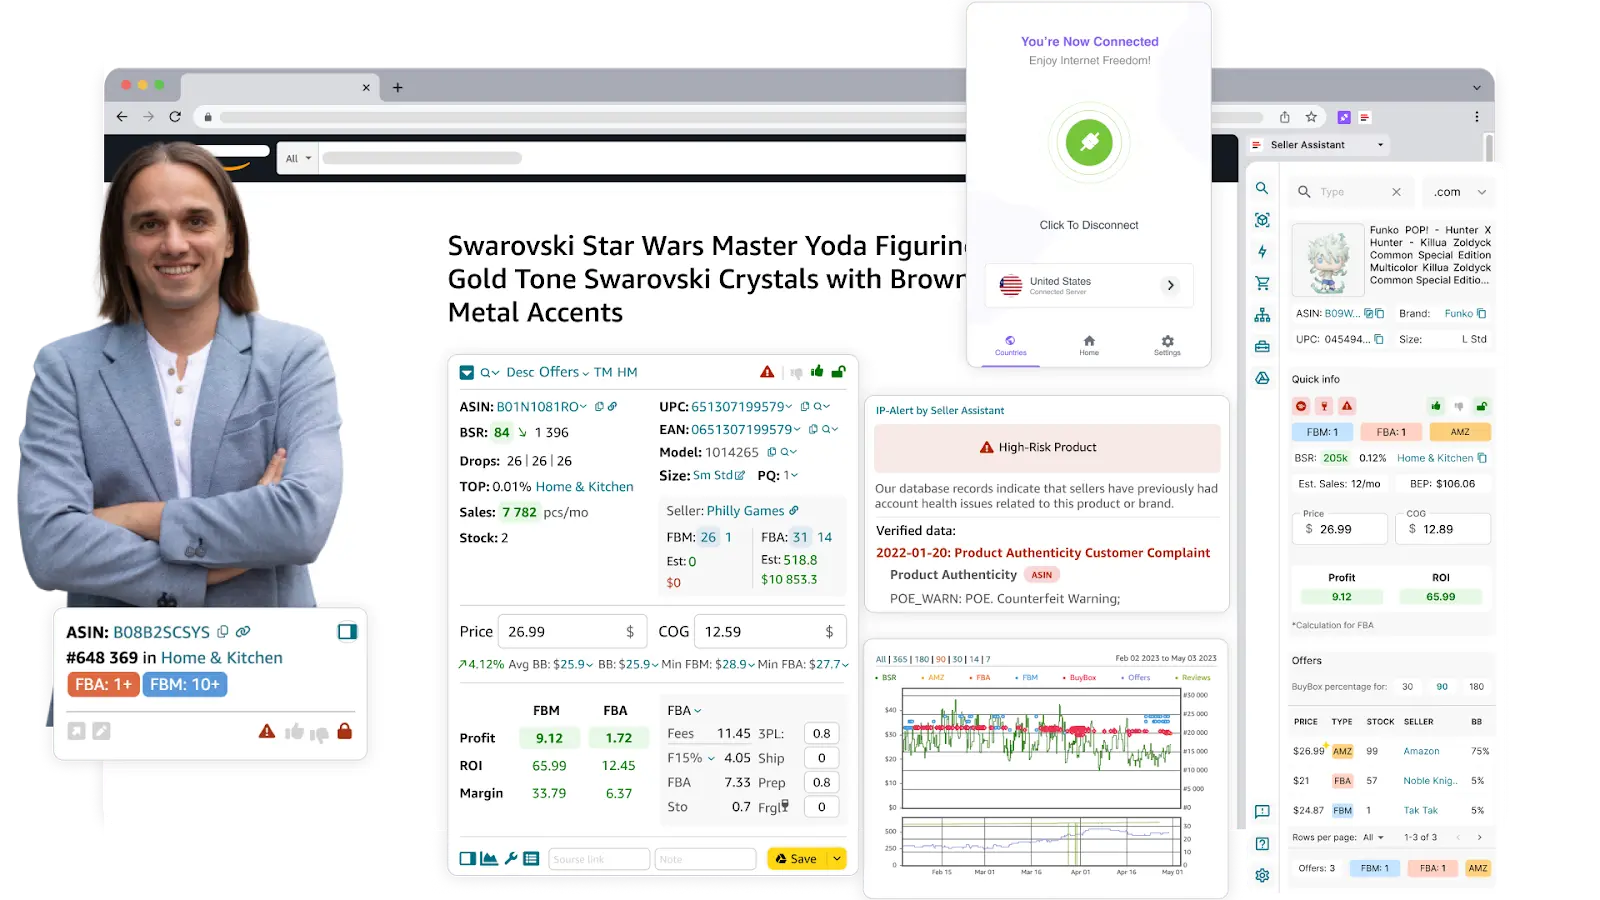
This tool is ideal for evaluating products one at a time with precision and speed – ensuring your deal decisions are backed by complete data.
Supplier analysis metrics
Brand research helps sellers determine whether a brand is worth reselling by analyzing key indicators such as revenue potential, product volume, Amazon competition, and restrictions. This ensures you’re focusing on high-demand, low-risk, and profitable brands that align with your sourcing strategy – whether you’re doing Amazon wholesale or Amazon arbitrage.
Below are the essential metrics to consider when evaluating a brand.
Supplier details
- Products
The number of unique products offered by the brand. A higher count indicates broader market presence and reduces the likelihood that it’s a private label or trademarked brand. Brands with over 50 products are less likely to be private label; over 500 products is a strong indicator of a scalable reselling opportunity.
Potential revenue
- Brand monthly revenue
Estimates the total revenue the brand generates across all its products per month. This helps assess whether the brand is active, profitable, and worth targeting.
- Average selling price
The average Buy Box price across all products under the brand. Helps gauge where the brand sits in the pricing spectrum – low-ticket vs. premium – and align it with your business model.
- Average FBA fees
The average fulfillment fees charged by Amazon for the brand’s products. Useful for estimating costs and calculating Return On Investment in advance.
Competition analysis
- Amazon in-stock rate
Shows how often Amazon holds the Buy Box for the brand’s products. A rate above 30% indicates aggressive competition from Amazon, which may squeeze your margins and visibility.
- Average FBA seller count
The average number of FBA sellers per product within the brand. A high count – usually above 15 sellers – signals strong competition and possibly reduced profitability.
Customer feedback and brand reputation
- Average rating
The average customer rating across all the brand’s products, from 1 to 5 stars. A higher average reflects strong customer satisfaction and likely fewer return issues.
- Total reviews
Total number of product reviews across the brand. This reflects both popularity and maturity. Brands with few reviews may be new or suffer from poor sales traction.
How to calculate supplier metrics
A crucial step in wholesale sourcing is finding a reliable, resale-friendly supplier (brand or distributor for wholesale and retailer for online arbitrage and dropshipping). This involves more than just getting a price list – it requires evaluating whether the supplier’s products align with your business model and revenue goals.
To do that, sellers must analyze a set of brand-level metrics we already discussed. These metrics reveal whether a supplier is offering scalable, in-demand products or just crowding your catalog with high-risk, low-return items.
Supplier analysis: Seller Assistant’s Brand Analyzer
Manually conducting supplier analysis across hundreds of suppliers can be time-consuming. That’s where tools like Seller Assistant's Brand Analyzer comes in. This tool automates the supplier research process by delivering real-time, data-backed insights into any brand’s resell potential.

You simply enter the brand name, and the tool instantly evaluates the total number of products under the brand, how much the brand’s catalog earns monthly, average product and Buy Box price, competition levels, average ratings and review volume.

This streamlined, metric-driven approach allows you to filter out weak suppliers and prioritize those that offer consistent, profitable, and scalable inventory for resale – saving time and increasing confidence in your sourcing decisions.
Operational Performance Metrics
Once your offer is listed and live on Amazon, your job as a seller shifts from research to performance management. Operational performance metrics are the numbers that track how well your business runs day to day.
These metrics are not about whether to buy – they’re about how efficiently you're selling, how much profit you’re actually making, and whether your account stays healthy and competitive.
Monitoring these metrics helps you make data-driven decisions to boost profitability, optimize listings, manage inventory, and maintain your seller privileges. Ignoring them risks margin erosion, stockouts, poor Buy Box performance, or even account suspension.
Sales and profitability
Sales and profitability metrics show how much you’re selling and how much you’re actually earning. They help you understand which products perform best, where your money is going, and whether your pricing strategy is sustainable.
Tracking these metrics is essential for identifying high-performing listings, optimizing margins, and making informed growth decisions. Without them, you risk selling at a loss or missing profitable opportunities.
Sales and profitability metrics
Revenue
Total income generated from product sales. A top-line metric that provides a clear picture of business growth.
Gross profit
The total profit before subtracting operational expenses like storage, returns, or advertising.
Formula: Gross Profit = Revenue – Cost of Goods Sold (COG)
Net profit
Revenue minus all associated costs including product, fees, logistics, returns, and taxes. A critical metric for understanding actual earnings.
ROI
Shows how efficiently your capital is being used. Low Return On Investment on live listings may signal the need to reprice or drop underperforming products.
Profit margin
Helps evaluate how much of your revenue is being retained as profit. Low margins can trigger pricing or sourcing adjustments. Formula: Net Profit ÷ Revenue × 100%
Sales velocity
Measures how quickly a product is selling over a specific time period. High sales velocity means faster turnover and better cash flow.
Daily / weekly / monthly units sold
Tracks sales volume over key time frames. Helps you adjust restocking frequency and advertising strategies.
Refund rate
Percentage of orders refunded. High rates can reduce profitability and affect account health.
Promotion-adjusted revenue
Revenue after subtracting discounts and promotional costs. Offers a true view of profitability when running sales or coupons.
Average order value (AOV)
The average dollar amount spent per transaction. Helps assess customer buying behavior and optimize bundling or upsell strategies. Formula: Revenue ÷ Number of Orders
Amazon fees
Understanding Amazon fees – especially for FBA (Fulfillment by Amazon) – is critical to calculating real profitability. These fees directly impact your margins and often make the difference between a winning product and one that silently drains your cash. Many new sellers underestimate how much these charges add up, especially across large catalogs.
By tracking fee-related metrics, you can accurately calculate total costs, set the right price points, and avoid products with hidden or excessive fees. Knowing your numbers helps ensure you’re not just selling, but actually making money.
Amazon fee metrics
Amazon charges a variety of fees that directly impact your profit margins. From referral and FBA fulfillment fees to storage and shipping costs, each fee adds up – and overlooking them can turn a seemingly profitable product into a loss. That’s why tracking Amazon fee metrics is essential. These metrics help you calculate true product costs, set profitable prices, and avoid unexpected expenses that can eat into your bottom line.
FBA fees
Amazon’s charge for picking, packing, and shipping your product through their FBA network. This varies by product size, weight, and category.
Referral fee
Amazon’s commission on each sale, usually a percentage based on product category. It’s automatically deducted from your revenue.
Storage fees
Monthly fee for storing products in Amazon’s warehouse. Can vary based on time of year, product size, and whether it's classified as standard or oversize. Amazon FBA Storage Fees
Amazon charges storage fees monthly, based on the space your inventory occupies. These fees increase during Q4 and for aged or oversized inventory. Monitoring this cost helps avoid unnecessary expenses and supports lean inventory practices.
Variable closing fee
An additional fee for BMVD (Books, Music, Video, and DVDs) products. It applies on top of referral fees.
Digital service fee (DST)
A region-specific fee applied to Amazon’s services in countries like Canada, France, or Spain. Can impact both selling fees and FBA fees.
Inbound shipping costs (FBA)
Cost of sending your products from the prep center or supplier to Amazon’s fulfillment center. A key part of your landed cost.
General prep FBA
Charges for prep services like labeling, polybagging, or bundling done before products reach the fulfillment center.
Hazmat fee FBA
Applied to hazardous materials. These products may also require additional approvals or restrictions.
Fragile prep FBA
Extra fee for handling fragile items that require special packaging.
Shipping cost per unit / per lbs
Used to calculate transportation expenses, especially relevant if you handle your own prep and shipping.
Misc fee rate (%) / misc fee fixed / misc fee
Covers any additional one-time or variable costs not included in standard fees. These should always be accounted for in total COG calculations.
Inventory management
Tracking inventory is about more than just knowing what’s in stock – it’s about making sure you’re not losing money to overstocking, stockouts, or long-term storage fees. Poor inventory control leads to tied-up capital, missed sales, and increased holding costs. That’s why understanding key inventory metrics is essential for keeping your Amazon business lean, responsive, and profitable.
These metrics help you plan smarter restocks, avoid FBA penalties, maintain Buy Box eligibility, and ensure that your cash flow isn't locked in unsold goods. With accurate inventory data, you can move products faster and keep your catalog performing.
Inventory management metrics
Managing inventory effectively is key to maintaining profitability and operational stability on Amazon. If you overstock, your capital is locked in unsold inventory and you may face higher storage fees. If you understock, you miss out on sales and hurt your Buy Box eligibility.
Inventory metrics help you maintain the right balance between product availability and cost efficiency – and prevent costly stockouts or overages. Here are the essential metrics every Amazon FBA seller should monitor.
Inventory Turnover Ratio
This metric shows how many times your inventory is sold and replaced over a period of time. A high turnover ratio means your products are selling quickly, which helps free up capital and reduce long-term storage fees. Formula: Cost of Goods Sold ÷ Average Inventory
Inventory Performance Index (IPI)
The IPI is Amazon’s score for how well you manage your FBA inventory. The score ranges from 0 to 1000, with higher scores indicating better efficiency. A low IPI may lead to storage limits or higher fees. The IPI is based on four key factors:
- Excess inventory
Products with more than 90 days of supply, based on Amazon’s demand forecasts. Keeping excess stock reduces your sell-through rate and inflates storage fees.
- Stranded inventory
Units that can’t be sold due to listing issues or restrictions. This inventory takes up space and doesn't generate revenue.
- Sell-through rate
Measures how fast you’re selling your inventory over the past 90 days. Formula: Units Sold (last 90 days) ÷ Average FBA Inventory
- In-stock rate
Reflects how often your replanishable ASINs have been in stock over the last 30 days, weighted by recent sales volume. High in-stock rates ensure consistent sales and Buy Box eligibility.
Monitoring and improving these factors helps raise your IPI score and maintain full access to Amazon storage and FBA services.
Stockout Rate
This metric tracks how often your products run out of stock. Frequent stockouts lead to lost sales, reduced Buy Box ownership, and lower IPI scores. Keeping essential SKUs in stock is crucial for maintaining listing momentum and customer trust.
FBA Capacity Limits
Amazon enforces FBA capacity limits to ensure efficient warehouse operations, especially during peak periods like Prime Day. These limits control how much inventory you can send into fulfillment centers.
- To avoid stockouts during high-demand events, sellers should:
- Monitor capacity in the Capacity Monitor
- Request additional space in advance via the Capacity Manager
- Submit a reservation fee (often refundable via performance credits)
Planning ahead ensures you can meet demand without being restricted by storage limitations.
Return Rate
This metric tracks the percentage of units returned by customers. High rates can reduce profitability and affect account health.
Account Health
Account health reflects how well you're complying with Amazon's selling policies and performance standards. It’s a direct measure of your reputation as a seller – and a critical factor in whether you’re allowed to continue selling on the platform. Poor account health can result in restricted listings, reduced visibility, FBA limits, or full Amazon account suspension.
To help sellers track their standing, Amazon provides an Account Health Dashboard inside Amazon Seller Central. This dashboard displays real-time data on your policy compliance, customer service performance, and unresolved violations.
Monitoring your account health is essential to stay active and competitive on Amazon. Even one overlooked violation or rising defect rate can trigger enforcement actions. By proactively managing your metrics and resolving issues, you protect your ability to sell, maintain customer trust, and ensure long-term success.
Account health metrics
Amazon holds sellers to strict performance standards to ensure a high-quality customer experience. Maintaining a healthy account isn’t just about avoiding penalties – it’s about staying in business. Poor account health can result in listing restrictions, fulfillment limitations, or even Amazon account suspension.
Amazon provides an Account Health Rating (AHR) to help sellers monitor their compliance. This score ranges from 0 to 1,000, with 400 or above considered "Healthy." A score below 400 signals risk, and anything under 100 may lead to immediate account deactivation. This rating considers your adherence to performance targets, policy compliance, and ongoing violations.
Here are the critical account health metrics every seller must monitor.
Order defect rate (ODR)
ODR reflects how well you’re meeting customer expectations. It’s the percentage of orders that result in a poor customer experience.
- Components of ODR include:
- Negative feedback rate: Customer reviews of 1 or 2 stars.
- A-to-z guarantee claims: Buyer complaints about non-delivery or product issues.
- Credit card chargebacks: Disputed transactions reported to the buyer’s credit card company.
- Amazon requirement: ODR must be under 1%. Exceeding this can lead to account restrictions or suspension.
- Formula: ODR = (Defective Orders ÷ Total Orders) × 100
Policy Compliance
Amazon monitors seller compliance across all policies, from restricted products to listing practices.
Violation types include:
- Suspected Intellectual Property Violations
- Received Intellectual Property Complaints
- Product Authenticity Customer Complaints
- Product Condition Customer Complaints
- Food and Product Safety Issues
- Listing Policy Violations
- Restricted Product Policy Violations
- Customer Product Reviews Policy Violations
- Other Policy Violations
- Regulatory Compliance
Each violation can negatively affect your Account Health Rating. Repeated violations or unresolved cases may lead to listing removals, selling restrictions, or full Amazon account suspension.
Late shipment rate (LSR)
- This metric tracks the percentage of seller-fulfilled orders shipped after their promised ship date. Timely shipping is essential for customer satisfaction.
- Amazon requirement: LSR must be 4% or lower.
- Timeframe: Measured over 10- and 30-day periods.
- Formula: LSR = (Late Shipments ÷ Total Orders) × 100
Cancellation rate
- This is the percentage of seller-cancelled orders before shipment confirmation. High cancellations suggest unreliable inventory or fulfillment practices. Customer-initiated cancellations do not count against you
- Amazon requirement: Cancellation rate must be under 2.5%.
On-time delivery rate (OTD)
- The percentage of orders delivered by the promised date based on valid tracking data.
- Amazon recommendation: Keep OTD above 97%. Failing to do so may lead to customer complaints, negative reviews, and account health risks.
Invoice defect rate (IDR)
- This metric applies to Amazon Business orders. It tracks how often sellers fail to provide valid invoices.
- Amazon requirement: IDR must stay below 5% to maintain eligibility for Amazon Business.
- Failure to comply can lead to restrictions or removal from the Business program.
Return rate metrics
Returns are inevitable, but return-related issues must be handled efficiently to protect your account.
- Late response rate
- Measures how quickly you respond to return requests or customer inquiries.
- Requirement: Respond within 48 hours to avoid performance hits.
- Negative return feedback rate
Tracks returns that result in negative customer feedback. High rates may indicate problems with product quality, listing accuracy, or customer service.
FAQ
What are the most important metrics to track for Amazon sellers?
The most critical metrics include ROI, profit margin, sales velocity, Buy Box price, inventory performance (IPI), order defect rate (ODR), and account health rating. These indicators help sellers assess product profitability, operational efficiency, and compliance with Amazon's policies.
Why do I need to calculate so many different metrics when sourcing a product?
Each metric reveals a different risk or opportunity. ROI and profit tell you if the product is worth selling. Sales rank and competition show how fast it might sell. Eligibility flags, IP risks, and fee breakdowns ensure you avoid hidden pitfalls. Skipping any of these can result in unsellable stock or losses.
What is a good IPI score, and how does it affect my FBA business?
A good IPI (Inventory Performance Index) score is above 400. A low IPI may result in FBA storage limits, which can restrict how much inventory you send to Amazon. High scores unlock full access to Amazon’s fulfillment resources and support efficient inventory management.
How does Seller Assistant help with product research?
Seller Assistant offers two powerful tools:
Price List Analyzer: Automates bulk wholesale list analysis by enriching data with key metrics like profit, fees, and risk flags.
Seller Assistant Extension: Provides real-time, in-depth insights on Amazon product pages and supplier websites – ideal for analyzing individual deals.
What happens if my Account Health Rating drops below 400?
If your Account Health Rating (AHR) drops below 400, your account is considered "At Risk." You may face restrictions on listing new products, reduced FBA capacity, or even suspension. It’s important to address any violations or performance issues immediately to recover and protect your seller status.
Final Thoughts
Mastering Amazon seller metrics is essential for building a profitable and sustainable Amazon FBA business. From sourcing the right products and evaluating suppliers to optimizing profitability and maintaining account health – every decision should be backed by data. Tracking these metrics allows you to make smarter choices, avoid unnecessary risks, and grow with confidence.
To streamline this process, tools like Seller Assistant can be game-changers. Whether you're scanning wholesale lists in bulk with the Price List Analyzer or analyzing individual products with Seller Assistant Extension, you’ll get the real-time insights you need to source smarter, sell faster, and stay compliant.
Seller Assistant is an all-in-one product sourcing software offering all the features vital for product sourcing. It combines three extensions: Seller Assistant Extension, IP Alert, and VPN by Seller Assistant, tools: Price List Analyzer, Brand Analyzer, Seller Spy, Bulk Restrictions Checker, and API integrations, and features: Storefront Widget, Side Panel View, FBM&FBA Profit Calculator, Quick View, Stock Checker, IP Alert, Variation Viewer, Sales Estimator, Offers, Restrictions Checker, and other features that help quickly find high-profit deals. Seller Assistant also offers integration with Zapier allowing to create custom product sourcing workflows.


